
At Zomato, our internal microservices and monolithic applications collectively produce a significant amount of logs each day. With a maximum production rate of 150 million logs per minute, this leads to the production of over 50 TB of uncompressed logs per day.
In the past, we stored all of these logs on self-hosted Elasticsearch. However, as the traffic on our platform and our services grew over time, our logs increased exponentially. Given this increase, managing the clusters became difficult from an operational standpoint. Given the nature of the business, we also had to over-provision our clusters for the variable traffic patterns. While the costs kept rising, we were unable to provide the experience we had originally hoped to.
Clicking with Clickhouse – Building LogStore
In the early days, we explored migrating a few sets of logs to S3 stored in ORC format using apache-spark – which would be queryable through Trino. While it definitely brought down the cost substantially, querying such huge logs and keeping query runtimes generous under 10s wasn’t possible. We had an ingestion lag of 5-10 minutes since we were writing large files to improve query latency. With the objective of keeping the end-to-end query latency under 1s and ingestion lag of less than a minute, we explored various options which could potentially replace the ELK stack.
Clickhouse emerged to be the best candidate for our use case, and we decided to move forward with it. It could handle terabytes of data while keeping the latency low. Also, Clickhouse is horizontally scalable, with a shared-nothing architecture. This further reduced the operational overhead.
Behind the curtain: The wizardry of our design decisions
We used various design choices to achieve high performance from the setup while keeping the costs low.
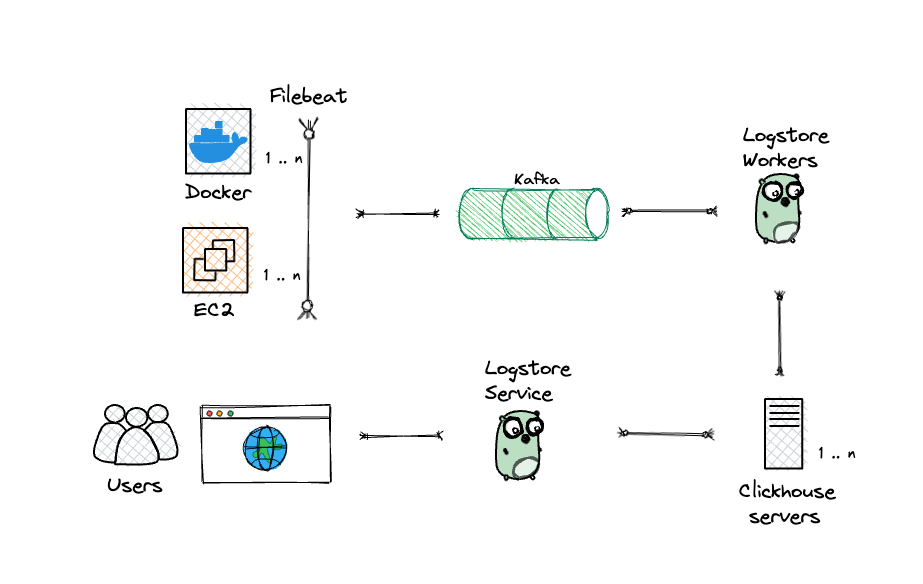
Scale Description: As previously mentioned, the data size, at times, was more than 50 TB daily, with events peaking at 150M/ minute. The requirement for querying all these logs within seconds of their production was paramount. LogStore received about 12,000 queries/day with a time range from 15 minutes to 7 days. To cater to this, the Clickhouse cluster ran 10 AWS EC2 nodes of M6g.16xlarge. The current cluster was scaled up to cater to burst queries in case of any production incident.
Inserts: Instead of relying on Clickhouse Kafka plugins, we opted for custom Golang workers. These workers efficiently batched the requests and performed insertions into Clickhouse, significantly reducing the overhead on Clickhouse. To optimize costs, we ran these workers on spot instances, resulting in additional savings.
To optimize performance, the inserts were batched to minimize I/O and CPU cycles. We grouped up to 20,000 messages per table, ensuring a maximum lag of 5 seconds. This approach significantly reduced the number of inserts at Clickhouse.
For faster data ingestion, we leveraged the native format to insert data into Clickhouse, achieving a speed boost of approximately 1.8 times compared to using HTTP. This native format was also less I/O intensive, resulting in more efficient processing by Clickhouse.
To distribute the workload evenly, the workers followed a round-robin strategy, inserting the batched logs into any available Clickhouse node. If a node was unavailable or under heavy load, the request was seamlessly redirected to another functioning node. This ensured a robust and reliable data ingestion process.
Schema Design: One of the most significant challenges was designing a schema that could accommodate the semi-structured nature of logs. This was achieved by creating a semi-structured table design, where the logs’ common columns are kept at the top level, and all unmatched columns are dumped into a map<String, String> column.
This map exploded to the top level in the API, making it easy for clients to access the data. The top-level fields can use special codecs per column to improve the compression ratio. Also, we use LowCardinality String wherever possible to achieve a very high compression ratio for columns.
create table if not exists foo_service (
	ts          	Datetime,
	env         	Lowcardinailty(String),
	container_id	Lowcardinailty(String),
	trace_id    	FixedString,
	msg         	String,
	offset      	Uint64 codec(DoubleDelta,zstd)
	_others     	Map<LowCardinality(String), String>
	INDEX foo_service_msg_index
	TYPE tokenbf_v1(212062,3,0)
	GRANULARITY 1
)
Engine = MergeTree
Partition by toYYYYMMDD(ts)
order by (env, trace_id, ts)
Custom SDK: The schema problem also needed to be fixed at the root level by urging the developers to use structured logging, instead of dumping everything into the message column and then finding a needle in the haystack. We built an SDK which helps in structuring the logs. This SDK standardized some top-level fields – like caller, log production time, log production stream, etc. so that it was easier to manage and clean up logs.
   log.With(
        log.Int("user_id", userID),
        log.String("url", url),
        log.Err(err),
    ).Info("could not make http request")
So that the user can search the logs with user_id.equals(1) instead of message like ‘%user_id = 1 %’
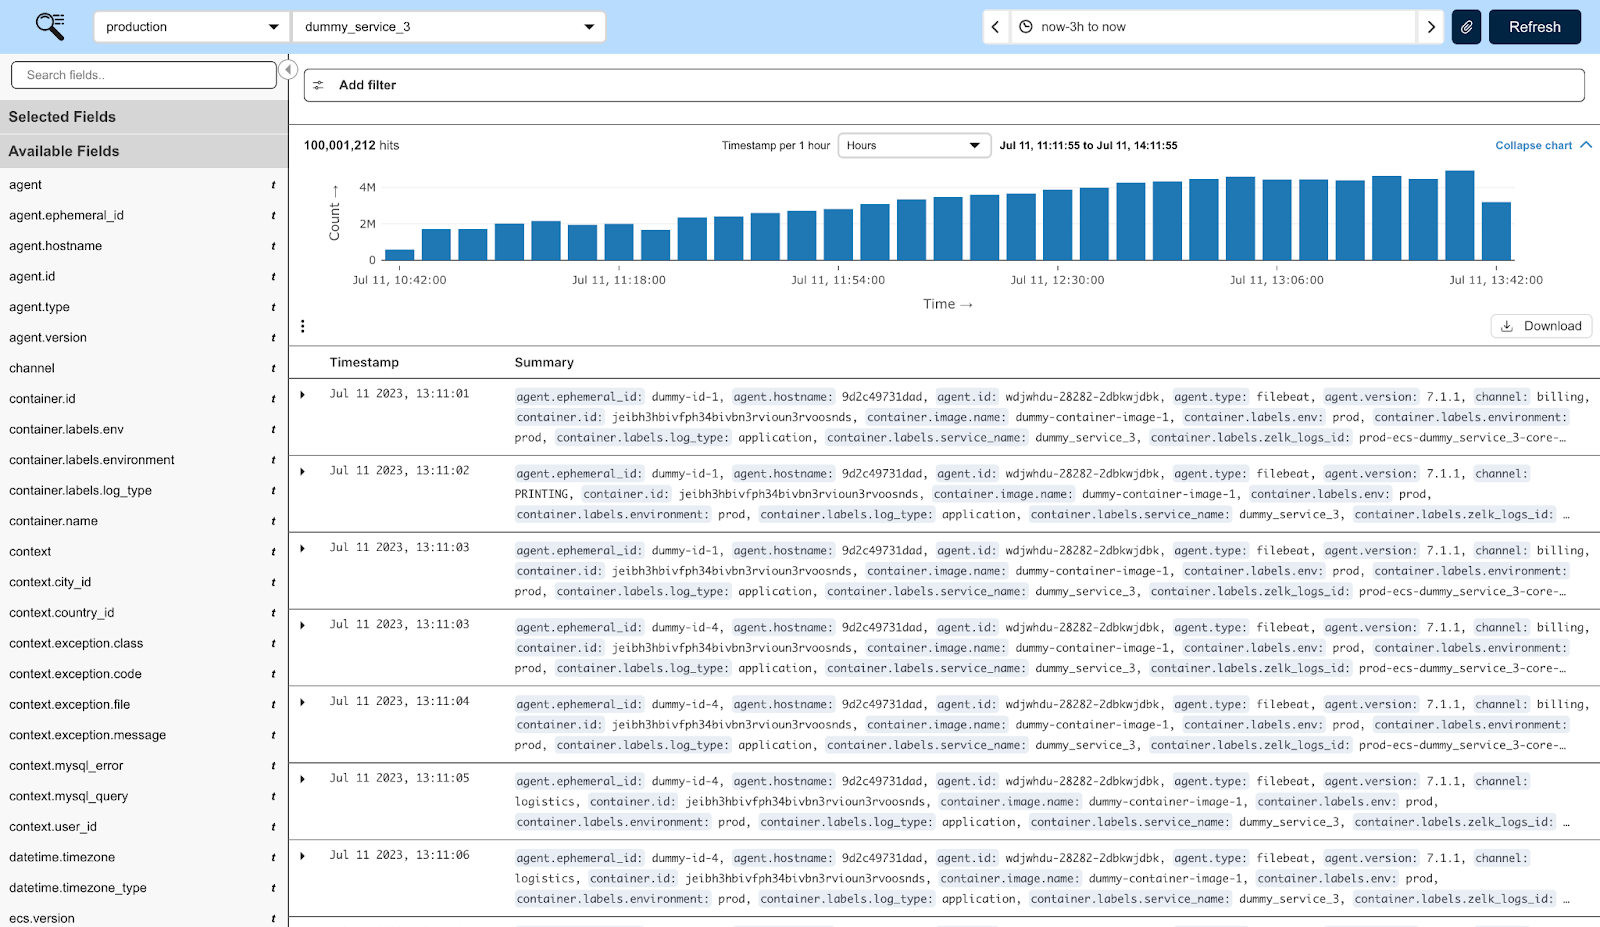
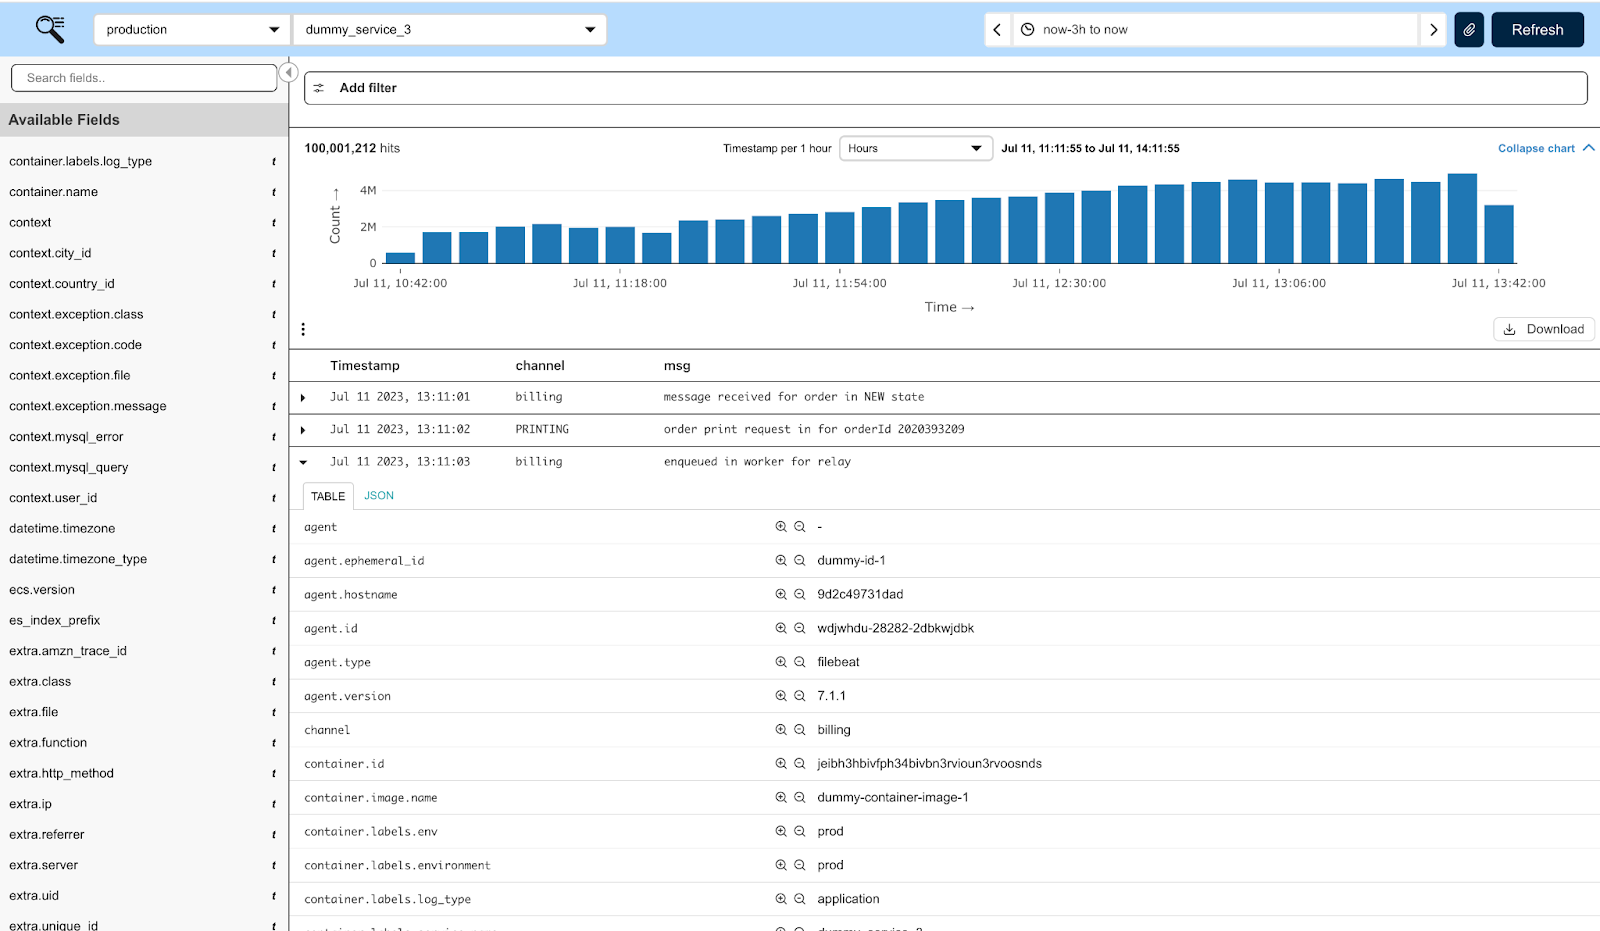
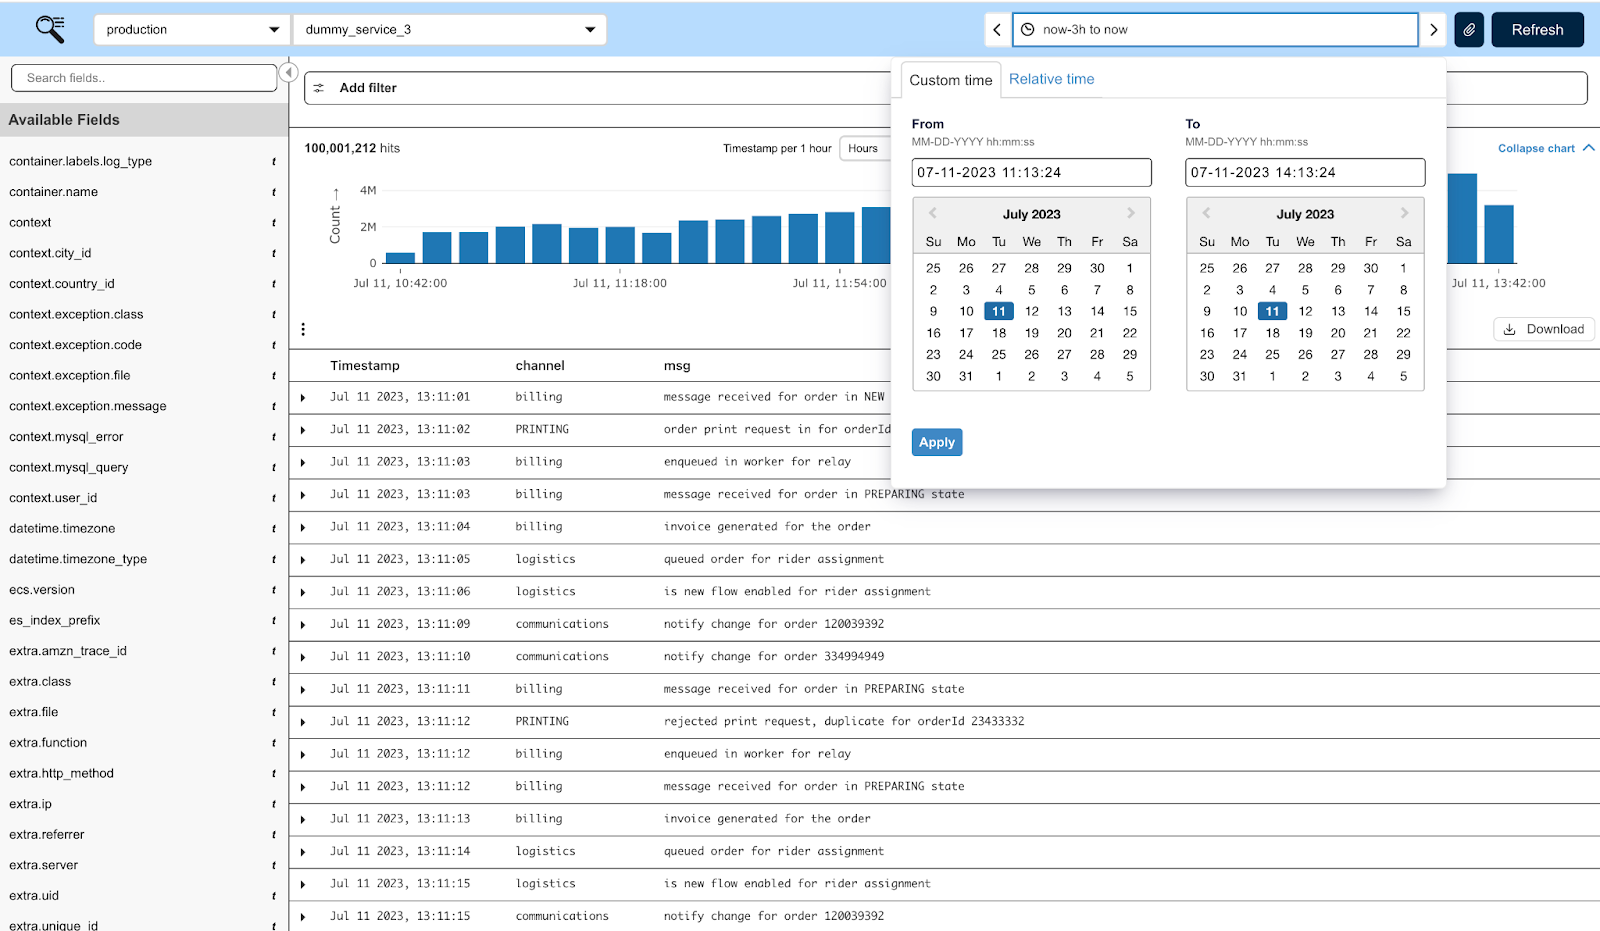
Frontend: We built a custom dashboard for developers to apply filters and view logs. The dashboard’s web vitals score is at par with industry standards with an FCP score of 0.95 seconds and an LCP score of 1.90 seconds. To achieve this, we used a lazy loading technique which defers loading of non-critical resources at page load time. We also built a filter application and date range picker flow which is open for any customizations in the future according to developer needs. Since log data is huge (approx 3K records / 1MB), we cannot render all the data on the page at once. We applied DOM virtualization concepts to render only a required number of records that are visible in the viewport.
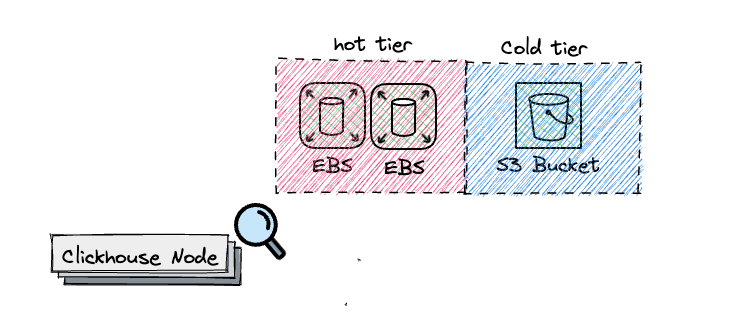
Replication: We opted out of replication, and consequently Zookeeper, to simplify operations since the data is already persistent on S3 and the attached EBS is being backed up. In case of an unmerry event, the new node gets attached to the EBS and is up and running in no time.

Data Tiering: We manage the data lifecycle by moving older data to the cold tier from the hot tier after every 24 hours using TTL and delete the data after 3 months . For our workload, which was mostly CPU and I/O bound, it made sense to use AWS Graviton C6g instances. To cope with IO-intensive workloads, each node was attached to multiple disks with gp3 disks with 4000 IOPS and 1000 MB/s.
Secondary Indexes: By utilizing the tokenbf_v1 index, the speed of like queries improved as many parts were bypassed if the index didn’t match. This was particularly beneficial for queries that involved scanning large amounts of data, which would otherwise be prohibitively costly to execute on their own and surpass scan limits.
The inverted index was recently added as an experimental feature in Clickhouse, but it led to frequent memory issues and performance degradation in our POC. We could switch to inverted indexes once it matures.

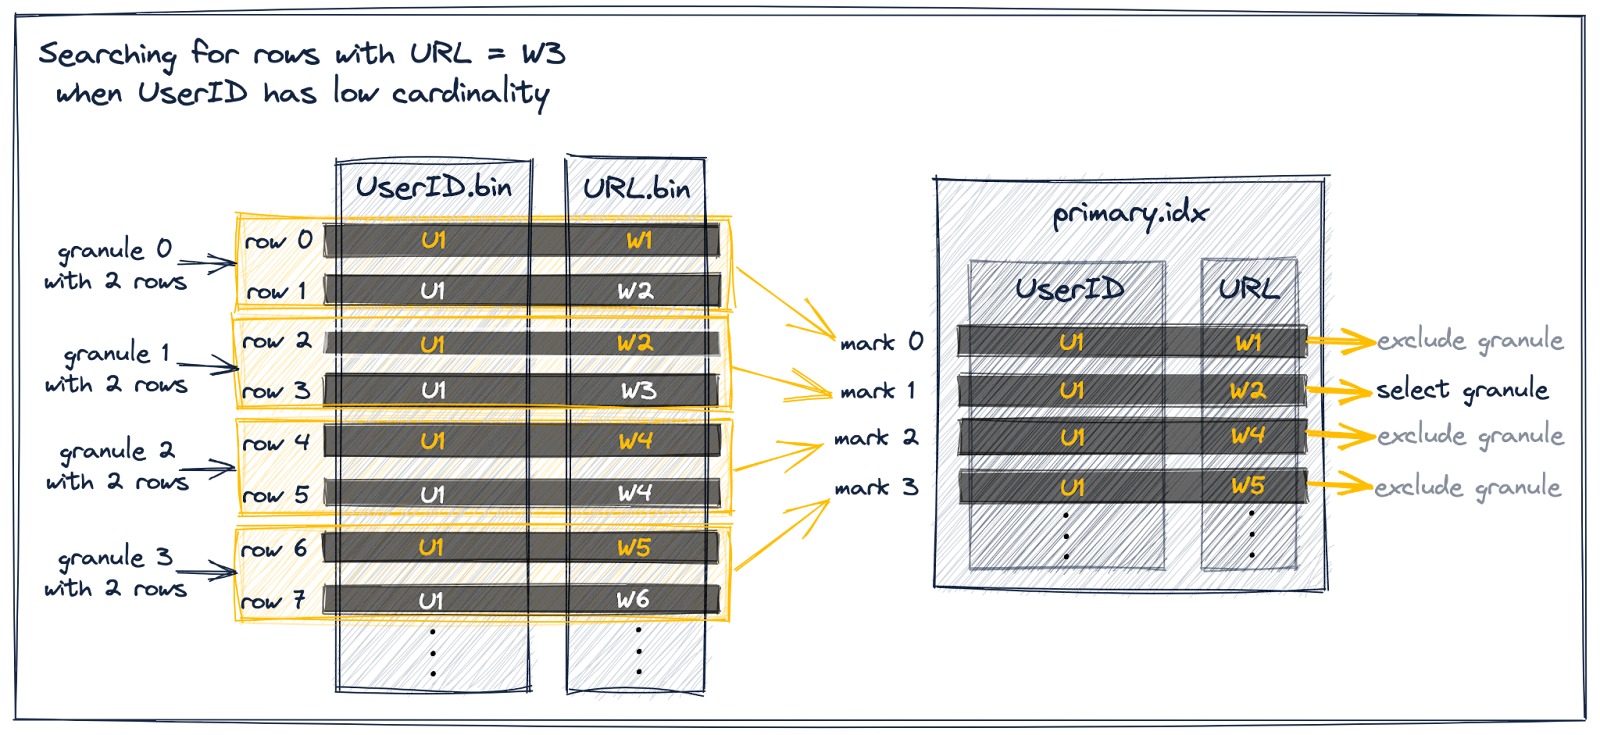
Deciding the Size of Bloom Filter: “A Bloom filter is a space-efficient probabilistic data structure that is used to test whether an element is a member of a set.” False positive matches are possible, but false negatives are not – in other words, a query returns either “possibly in set” or “definitely not in set“. We used bloom filter in the tokenized message column to verify if the search query was present, effectively filtering out non-matching granules, thus speeding up the search results.
For each block of 8000 records with an average of 50 words per record, n ( number of elements in a filter ) = 400K, p (probability of false positives ) as 0.1 and 3 hash functions i.e. k. The size of filter per block tends to be 235 Kib. This helps in speedy search results which can handle all the records.
n = ceil(m / (-k / log(1 – exp(log(p) / k))))
p = pow(1 – exp(-k / (m / n)), k)
m = ceil((n * log(p)) / log(1 / pow(2, log(2))));
k = round((m / n) * log(2));
Ensuring resiliency of the system: The system implemented query throttling mechanisms at both the user and system levels to tackle the problem of performance degradation caused by an overwhelming number of queries.
In instances where the system was inundated with a significant number of unoptimized queries, it selectively terminated the queries that were consuming excessive resources or taking an unreasonably long time to execute, prioritizing other queries and ensuring the system’s continued availability to most users. Additionally, the read queries’ niceness was enhanced to prioritize writes in case of any unforeseen issues.

Monitoring: ClickHouse server has embedded instruments for self-state monitoring. We scraped clickhouse metrics via prometheus, and then visualized and set alerts over it via grafana.
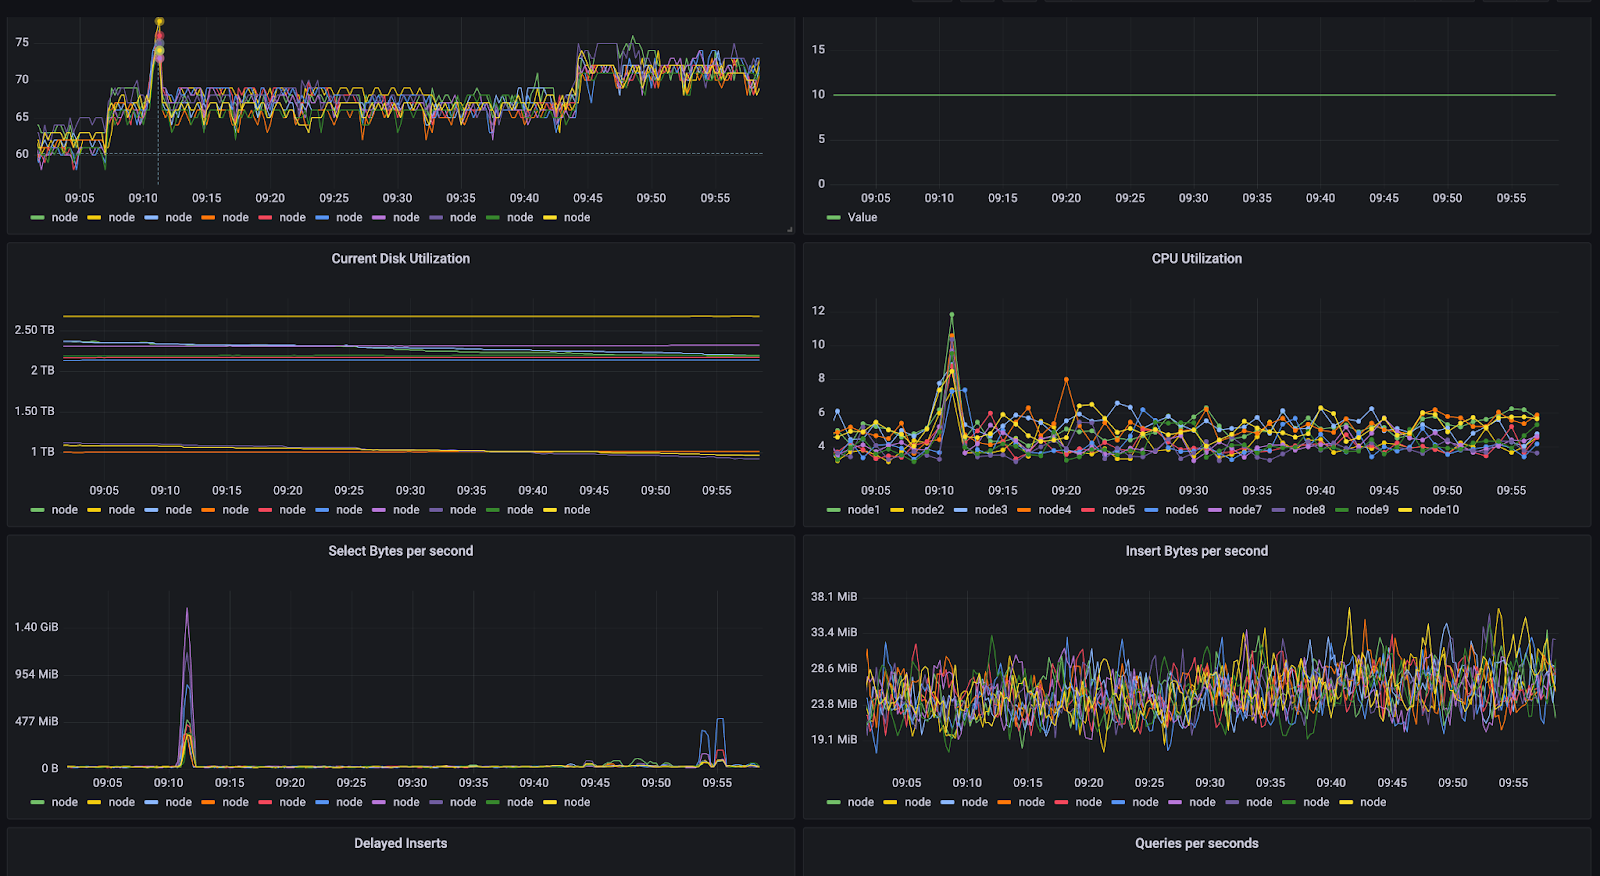
We closely monitored various system health metrics such as CPU, Memory and Network, as well as specific Clickhouse metrics like delayed or rejected inserts, insert time, and query time. This helped us ensure that the system is both reliable and performing optimally.
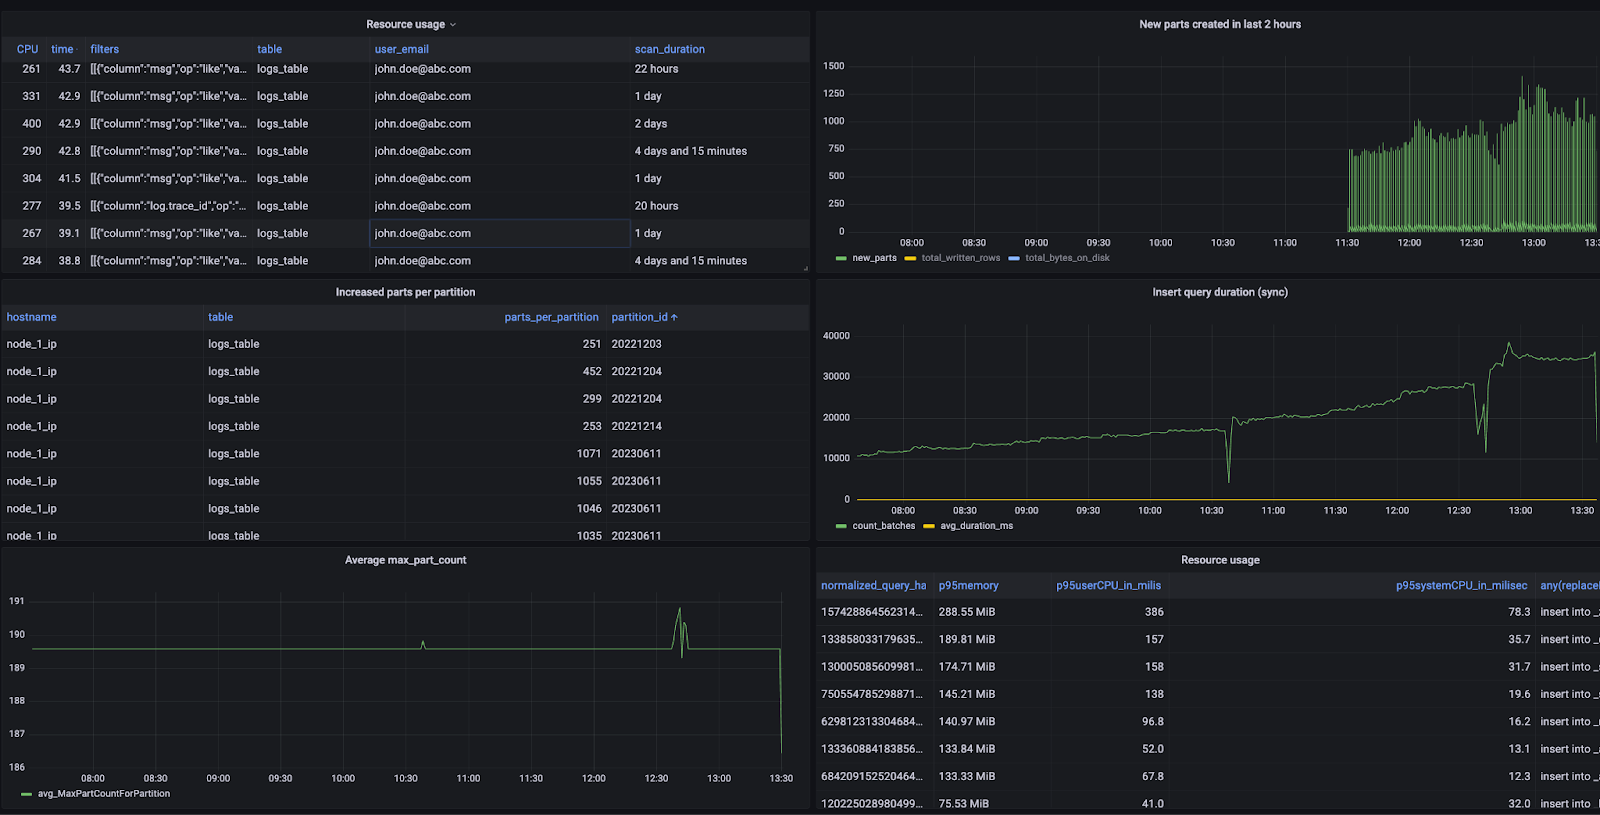
In addition, we measured 95th percentile query run time at the table level, enabling us to evaluate performance and identify patterns in query behavior. Based on these insights, we could take steps such as adding indexes or sort keys, improving logging patterns, and more, to improve overall system performance.
Security: To ensure that only authorized individuals can access and query the logs, we employed features such as Google Authentication, Table-level access control, and Query Auditing. These measures helped enhance security and prevent unauthorized access to sensitive information.
Impact
Migrating to ClickHouse had a significant impact on our systems. Here’s how ClickHouse proved to be a game-changer:
Reliability: Real-time Data Ingestion – Ingestion lag of less than 5 seconds ensured real-time data availability, minimizing discrepancies and supporting timely decision-making.
Performance: Lightning-Fast Queries – P99 query time of 10 seconds accelerated data processing, delivering actionable insights promptly. For example, querying the largest index with the right filters for 7 days takes less than 20 seconds.
Customizations: Tailored Solutions – Our in-house solution allowed us to customize and adapt the platform to our specific requirements. This flexibility surpasses the limitations we previously faced, such as losing visibility due to paid access logs.
Auditing and Cost Savings – LogStore’s auditing capabilities and cost-effectiveness has the potential to save more than a million dollars per year compared to our previous setup, without compromising on system reliability and security.
What’s the compass pointing towards?
With new services emerging every day and evolving requirements, our project’s future plans include:
- Enhancing full-text search capabilities through the incorporation of inverted indexes.
- Providing LogQL query support to power advanced use cases.
- Adding support for similar logs and patterns to categorize errors and their frequency.
- Building an automated system to fine-tune indexes and improve search experience using query patterns.
- Migrating to Open-Telemetry logging standard
This blog was written by Anmol Virmani and Palash Goel in collaboration with Bhavya Rustgi and Sameer Saxena, under the guidance of Himanshu Rathore and Umar Ahmad.
More for you to read
Technology

Local Preview is a developer productivity tool that enables local machines to connect to the service mesh. It allows us to test new features on the app, within seconds, without waiting for continuous integration/continuous delivery (CI/CD).
Technology

In the world of real-time streaming data, robustness isn’t a luxury—it’s a necessity.
Technology

Espresso is our open-source PDF generation and signing solution. It delivers PDFs in under 200 milliseconds while reducing server costs by 90%. Built on Go and Chromium, it’s fast, scalable, and now available to the community at large.
Technology

How we built a self-serve stream processing platform to empower real-time analytics